| Location: Home>News>Research news |
| Progress on atmospheric nitrogen, phosphorus and acid deposition in China |
|
|
With the rapid development of economy and fast rising energy consumption, China has become one of heavy nitrogen and acid deposition area. Therefore, how to scientifically evaluate the atmospheric nitrogen deposition, acid deposition and its ecological effects has been highly concerned by the scientists and the public. In the past few years, the YU’s research team using network observation and integration of literature data, carry out the observations and research work on atmospheric nitrogen, phosphorus and acid deposition flux, its spatio-temporal patterns and influencing factors in China.
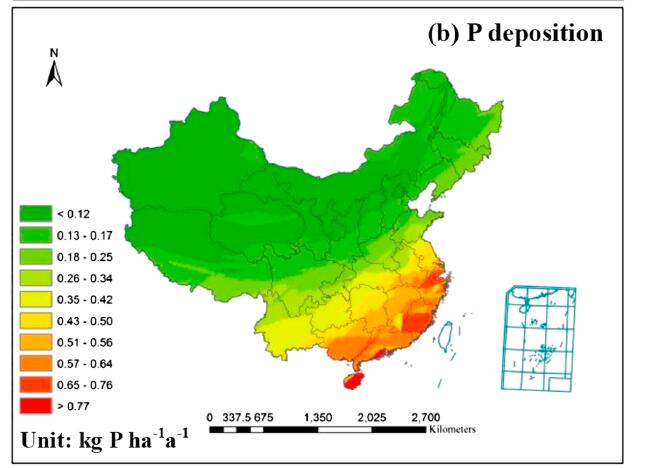
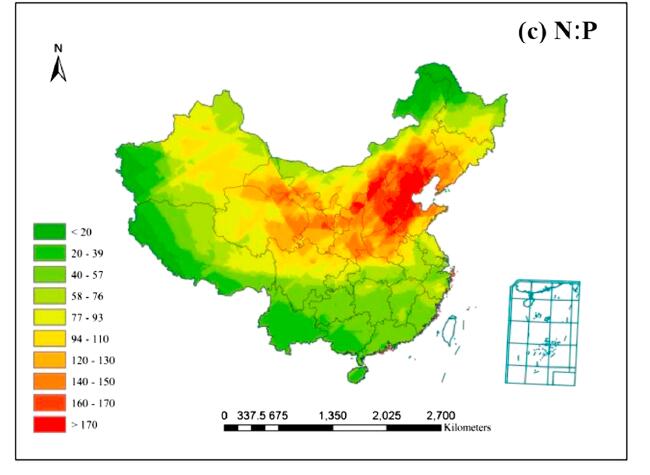
Observation from the initial site (Sheng et al., 2012), Transect (Zhan et al., 2014), and gradually expand into atmospheric nitrogen, phosphorus, acid deposition observation network of typical terrestrial ecosystems based on CERN stations (Figure 1). At the same time, establishment of technical specifications and procedures of network observation improved the data accuracy and comparability. Based on the obtained data, the research team quantitative evaluated, for the first time on national scale, the composition of the wet N deposition in China(Zhu et al., 2015; He et al, 2015), and further obtained phosphorus deposition (Zhu et al. 2016a), acid deposition (Yu et al., 2016)and heavy metal deposition (Zhu et al., 2016b) of China. Average deposition fluxes of N and P were 13.69 kg ha - 1 yr - 1 kg and 0.21 P ha - 1 yr - 1, and average N:P ratios of atmospheric wet deposition was 77. For the first time they suggested that the imbalanced atmospheric N and P deposition will alter nutrient availability and strengthen P limitation, which may further influence the structure and function of terrestrial ecosystems(Zhu et al., 2016a).
Their results showed that the mean N wet deposition over China increased approximately 25%, from 11.11 to 13.87 kg ha–1yr–1 in the 1990s to 13.87 in the 2000s. N wet deposition was highest over southern China and exhibited a decreasing gradient from southern to western and northern China.
They compiled a worldwide dataset of atmospheric inorganic N concentrations from 555 ground monitoring sites, including 7,424 site-year data, downloaded OMI NO2 column standard products between 2005 and 2014, and data on dry deposition velocities from 163 sites worldwide. Based on the chemical transformations between airborne reactive N, They developed methods that can, for the first time, determine the 2005-2014 global patterns and trends in dry deposition fluxes directly from ground- and space-based data. The average annual dry N deposition change was 7.78 kg N ha–1 yr–1.The averages of the NO2, HNO3, NH4+, NO3− and NH3 fluxes in China were 0. 67,1.15, 0.07 and 5.61 kg N ha−1 yr–1, respectively.
Based on network monitoring data, they found the average precipitation pH is between 4.10 and 8.25 (average: 6.2) in Chinese agricultural and natural ecosystems, and the average deposition of SO42-and NO3- was 115.99 and 32.93 kg ha–1 yr–1, respectively. An apparent regional difference of acid deposition in Chinese agricultural and natural ecosystems was observed, which was most serious in south and central China and less serious in northwest China, Inner Mongolia, and Qinghai-Tibet. The level of economic development and amount of precipitation could explain most of the spatial variations of pH, SO42-and NO3- depositions(Yu et al., 2016). Industrialization and urbanization have led to increasingly serious levels of atmospheric heavy metal pollution. The atmospheric Pb, Cd, and Cr wet deposition ranged 0.06 ~ 5.80 mg m–2 yr–1,0.03 ~ 0.95 mg m–2 yr–1,0.24 ~ 2.10 mg m–2 yr–1. The wet deposition of Pb and Cd was positively related with the soil Pb and Cd contents. Human activities exert an apparent impact on the atmospheric heavy metal deposition through rainfall at both local and regional scales, on the atmosphere, water, and soil etc.
Spatial patterns of atmospheric N and P deposition from rainfall in China. The grids in the right hand corner of the figures represent the South China Sea
Publication lists: 1.Zhu JX, Wang QF, He NP, Smith MD,ElserJJ, Du JQ, Yuan GF, Yu GR, Yu Q. 2016. Imbalanced atmospheric nitrogen and phosphorus depositions in China: Implications for nutrient limitation. Journal of Geophysical Research-Biogeoscience, 121, doi:10.1002/2016JG003393.(IF = 3.3; http://onlinelibrary.wiley.com/doi/10.1002/2016JG003393/full) 2.Zhu JX, Wang QF, Yu HL, Li ML, He NP. 2016. Heavy metals deposition through rainfall in Chinese natural terrestrial ecosystems: Evidences from national-scale network monitoring. Chemosphere, 164: 128-133.(IF = 3.7; http://www.sciencedirect.com/science/article/pii/S0045653516311365) 3.Yu HL, He NP, Wang QF, ZhuJX, Xu L, Zhu ZL, Yu GR. 2016. Acid deposition in precipitation of Chinese natural ecosystems: Evidences from national-scale network monitoring. Journal of Geophysical Research-Atmosphere, 121, doi: 10.1002/2015JD02441.(IF=3.3; http://onlinelibrary.wiley.com/doi/10.1002/2015JD024441/full) 4.JiaYL, Yu GR, Gao YN, He NP, Wang QF, Jiao CC, Zuo Y. 2016. Global inorganic nitrogen dry deposition inferred from ground- and space-based measurements. Scientific Reports, 6:19810. (IF = 5.2; http://www.nature.com/articles/srep19810) 5.He NP, Zhu JX, Wang QF. 2015. Uncertainty and perspectives in studies of atmospheric nitrogen deposition in China: A response to Liu et al.(2015). Science of The Total Environment, 520: 302-304.(IF = 4.0; http://www.sciencedirect.com/science/article/pii/S0048969715003381) 6.Zhu JX, He NP, Wang QF, Yuan GF, Wen D, Jia YL, Yu GR. 2015. The composition, spatial patterns, and influencing factors of atmospheric nitrogen deposition in Chinese terrestrial ecosystems. Science of The Total Environment, 511: 777-785. (IF = 4.0; http://www.sciencedirect.com/science/article/pii/S0048969714017409) 7.Zhan X, Yu G, He N, Jia B, Zhou M, Wang C, Zhao J, Zhao G, Wang S, Liu Y, Yan J. 2015. Inorganic nitrogen wet deposition: Evidence from the North-South Transect of Eastern China. Environmental Pollution, 204: 1-8. (IF = 4.8; http://www.sciencedirect.com/science/article/pii/S0269749115001384) 8.Jia YL, Yu GR, He NP, Zhan XY, Fang HJ, Sheng WP, Zuo Y, Zhang D Y, Wang Q F. 2014. Spatial and decadal variations in inorganic nitrogen wet deposition in China induced by human activity. Scientific Reports, 4, 3763. (IF = 5.2;http://www.nature.com/articles/srep03763?WT.ec_id=SREP-704-20140121) 9.Sheng WP, Yu GR, Jiang CM, Yan JH, Liu YF, Wang SL, Wang B, Zhang JH, Wang CK, Zhou M, Jia BR. 2012. Monitoring nitrogen deposition in typical forest ecosystems along a large transect in China. Environmental Monitoring and Assessment, 185: 833-844. (IF = 1.6; http://link.springer.com/article/10.1007/s10661-012-2594-0) |